HyperAccel Profiler (hapti)
HyperAccel Profiler (hapti) records the execution flow of an application and the LPU on a single timeline and saves it in a format that the Perfetto and Chrome viewers can open. hapti stands for HyperAccel Profiling and Tracing Interface, and it profiles existing applications without modifying or rebuilding their code.
Key Advantages
- Profiling without code changes — Just put
haprofin front of the run command (for example,haprof -- python infer.py). No source changes, rebuilds, module imports, or initialization calls are needed. - Collection scope chosen by options — Run options set the collection scope, such as the device timeline and hardware counters, and the output location and format.
- Multi-rank trace merge —
haprof mergecombines the traces produced separately for each rank into one timeline. - PyTorch integration — A single line of code records device activity in the
torch.profilertrace as well.
For the design background, see Design Background in the Programming Guide.
Architecture Overview
hapti is an observation tool that does not take part in application execution. Kernel execution, memory management, and stream management are handled by the runtime (hart) and the LPU as before; hapti collects the execution record
and writes it to a trace file. Program behavior and results do not change; only execution time increases, by the profiling overhead.
| Role | Component |
|---|---|
| Kernel execution, memory, stream and event management | Runtime (hart) |
| Execution recording and trace file generation | hapti |
| Trace visualization and exploration | Perfetto UI, Chrome tracing, torch.profiler |
As the diagram below shows, hapti observes the execution layers (hart, KMD, LPU) and consists of the following
three parts.
- Entry points: the
haprofCLI that runs a program without code changes, the Kineto plugin that integrates intotorch.profiler, and Python annotations that mark code ranges - Collection scope: host API activity (runtime API and lower-layer calls), device activity (kernels and memory transfers), hardware counters, and the signal logger
- Timeline integration: merges the collected host activity and device activity into a single timeline
For a summary of each feature, see Key Features of hapti.
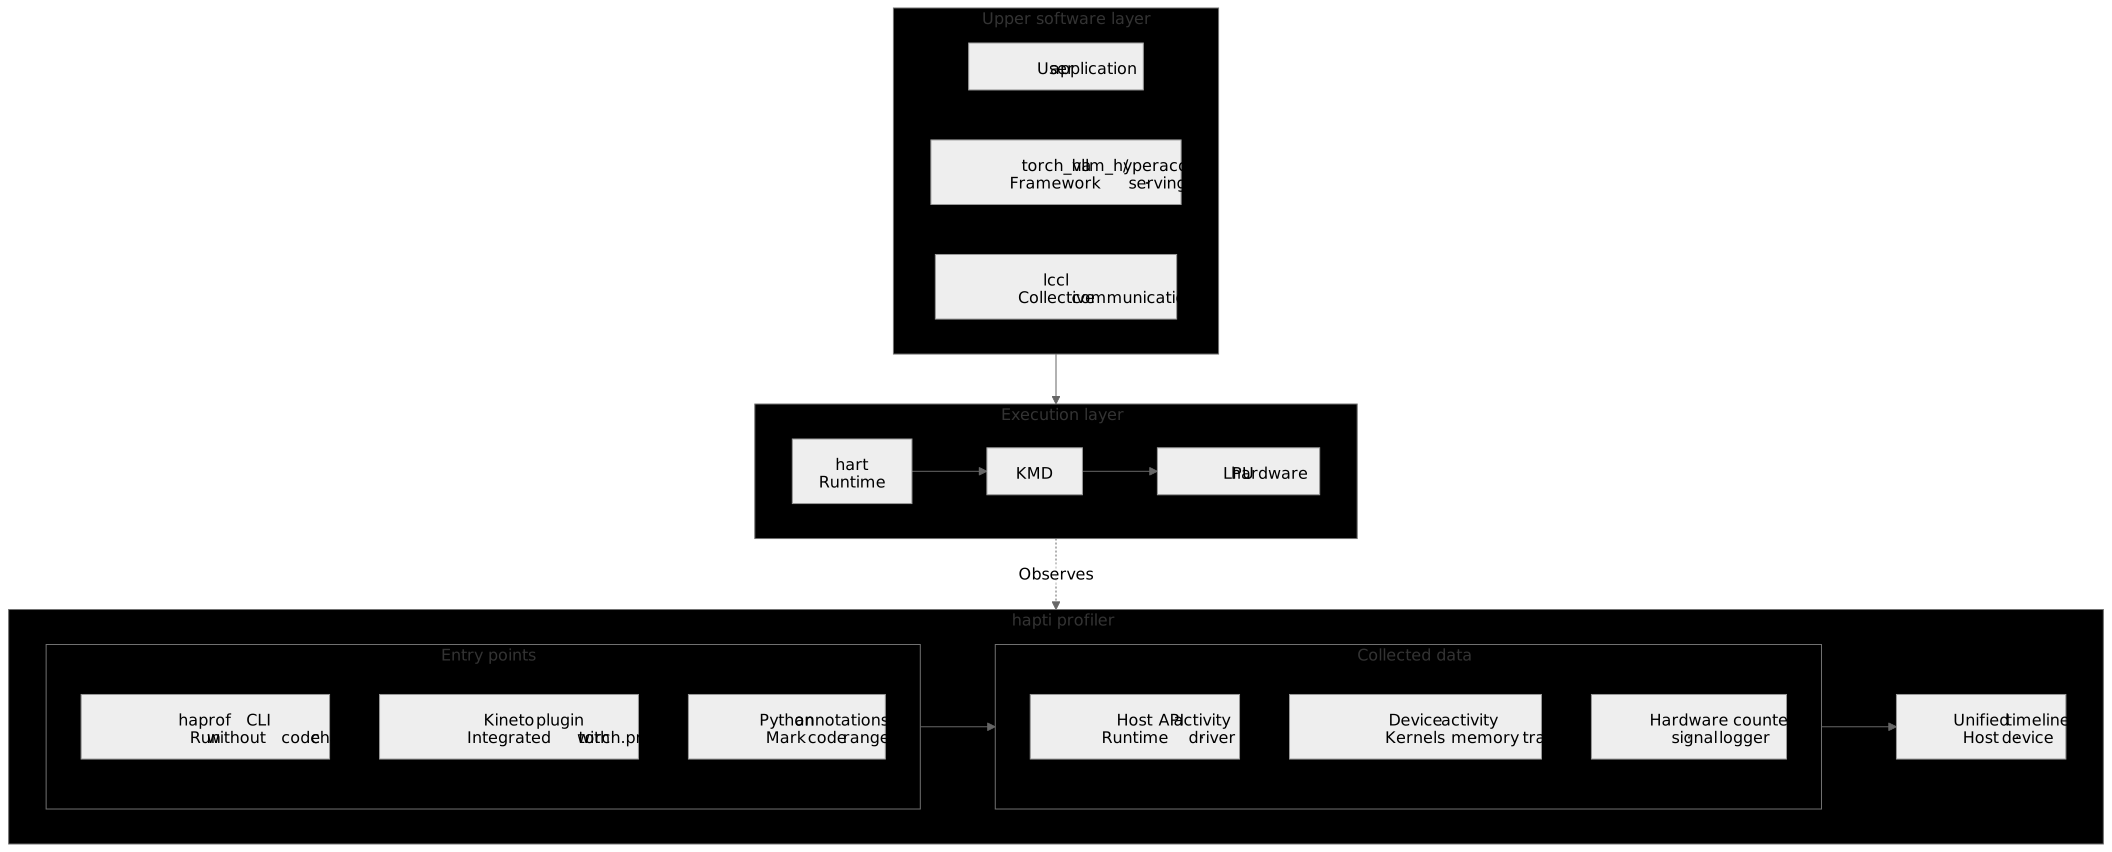
Position and features of hapti in the software stack
Key Features of hapti
This section summarizes the core features and operating principles of hapti. For details on each item and how to
use it in practice, see the Programming Guide and the
API Reference.
| Feature | Summary |
|---|---|
| Zero-Code Profiling | Profiles an existing program as is with a single haprof -- APP line. No source changes or rebuilds are needed, and it also applies to general programs outside PyTorch. |
| Host API Tracing | Records the runtime API calls made by the application and the lower-layer call ranges inside the runtime on per-process and per-thread lanes. |
| Device Activity Tracing | Records kernels and memory transfers executed on the LPU on per-device and per-stream timelines. Enabled with the --runtime-trace option (also included in --device-trace). |
| Per-Kernel Hardware Counters | Samples selected counters from 41 hardware events in 6 blocks for each kernel execution, so that memory-bound and compute-bound kernels can be told apart. |
| Signal Logger | Records the on/off signal state of the main units inside the device during kernel execution and shows it as tracks aligned to the kernel ranges. |
| Host-Device Correlation | Links a host API call to the device activity it caused through a correlation id. |
| Single Clock Domain | Converts both host and device records to host CLOCK_MONOTONIC nanoseconds, so traces from the same machine align on one timeline without extra correction. |
| User Annotations | Marks application phases on the timeline with Range and Mark annotations in Python code. |
| PyTorch Profiler Integration | Integrates device activity into the torch.profiler trace through the Kineto plugin and connects CPU operations to device activity with flow arrows. |
| Multi-Process Capture & Merge | Collects per-rank traces with --profile-children and merges them into a single timeline and a straggler report with haprof merge. |
| Standard Trace Formats | Saves in Perfetto (.pftrace) and Chrome JSON (.json) formats that open directly in Perfetto UI or Chrome tracing. |
| Low-Overhead Recording | Converts records on a separate worker thread to minimize the impact on the application. Device collection cost applies only in the modes that enable it. |
At a Glance
| Package | hapti |
| Version | 0.0.6 |
| Language | C++20 core, Python bindings (pybind11) |
| Artifacts | haprof CLI, libhapti_tool.so (preload tool), libhapti_kineto_plugin.so (Kineto plugin), libha_hapti.so (core), hapti Python module |
| Output formats | Perfetto (.pftrace), Chrome JSON (.json) |
| Integration | LD_PRELOAD (no source changes or rebuild required) |
| PyTorch integration | Kineto plugin |
| Hardware counters | 6 blocks, 41 events |
| Python | 3.10 – 3.12 |
| Status | Beta |
API Overview
In a typical user environment, the haprof CLI alone covers most of the needed features. The Python API is provided for annotations that name specific code ranges and for PyTorch integration.
| Category | Role | Main entry points |
|---|---|---|
| CLI | Runs a program under the profiler and merges traces | haprof · haprof merge |
| Python API | Annotations and PyTorch profiler integration | annotate · mark and 4 more, hapti.kineto.register |
Capturing Your First Trace
1 | |
The run creates <hostname>_<pid>_<starttime>.pftrace and .json files in the working directory.
Open the generated .pftrace file at ui.perfetto.dev.
To also collect the device execution record and per-kernel hardware counters, add the option below.
1 | |
Notes for Analysis
- Per-domain trace flags do not work yet.
--kernel-trace,--driver-trace, and similar flags are accepted but ignored, and host-side activity data is always collected in full. The support status of each option is in the CLI Reference. - Device time appears at batch boundaries, not at call time. Asynchronous execution returns as soon as work is enqueued, and device records are generated after the batch finishes. Do not infer causality from the horizontal position of host calls and device slices alone. See Device Tracing: When Device Records Are Collected.
- The default hardware counters are only the 20 events of core 0. If you need counters from other blocks or
cores, specify them with the
HAPTI_COUNTERSenvironment variable.
Installation
hapti is not provided as a separate package; it is distributed in a single HyperAccel SDK wheel package together
with the compiler, runtime, and framework integration components. For installation details, see the
SDK Installation Guide.
Compatibility
This documentation is written for hapti 0.0.6. Changes by version are listed in the
release notes.
| Verified version | |
|---|---|
| Python | 3.10 – 3.12 |
Runtime (hart) |
0.0.6 |
| Trace viewers | Perfetto UI, Chrome tracing |
For the full specification, see the Support matrix.
Documentation
 Programming Guide
How to capture a trace, what it contains, and how to read it.
Capturing a Trace · Device Tracing · Trace Data Analysis Guide · Annotations · Troubleshooting
 API Reference
Options, function signatures, and counter specifications.
CLI · Python API · Counter Reference · Environment Variables · Support Matrix
 Release Notes
Changes by version, deprecations, and known issues.