6. PyTorch Profiler Integration
haprof creates a separate trace file for the whole program process. For teams that already use torch.profiler,
this adds a separate profiler output next to the existing PyTorch trace, so CPU operations must be checked in the
PyTorch trace and device activity in the haprof trace, and the two compared by eye.
The Kineto plugin solves this. It integrates LPU activity into the PyTorch profiler's own trace, so an
aten::matmul operation and the device kernels it caused are connected directly by flow arrows. This chapter covers
how the plugin works, how to register and use it, what goes into the trace, and how to choose between it and
haprof.
Contents
| Section | Objective |
|---|---|
| 6.1 Kineto Integration Structure | Where vendor tracers plug into the architecture |
| 6.2 Registering the Plugin | One line of code that loads the plugin |
| 6.3 Running the Profiler | How to specify the PrivateUse1 activity |
| 6.4 Collected Items and Flow Arrows | Activity kinds and flow arrow linkage |
| 6.5 Device Timeline Collection | Conditions for enabling device records, and diagnostic messages |
| 6.6 When Records Are Converted | When records are converted into the trace, and loss conditions |
6.7 Choosing Between haprof and the Kineto Plugin |
Guide to choosing a profiler for each environment |
6.1 Kineto Integration Structure
libkineto is PyTorch's hardware abstraction layer for profiling. torch.profiler outputs a single
Chrome trace file, but the per-device events in it are filled in by each hardware vendor's tracer. The point where
these tracers plug in is the IActivityProfiler ABI.
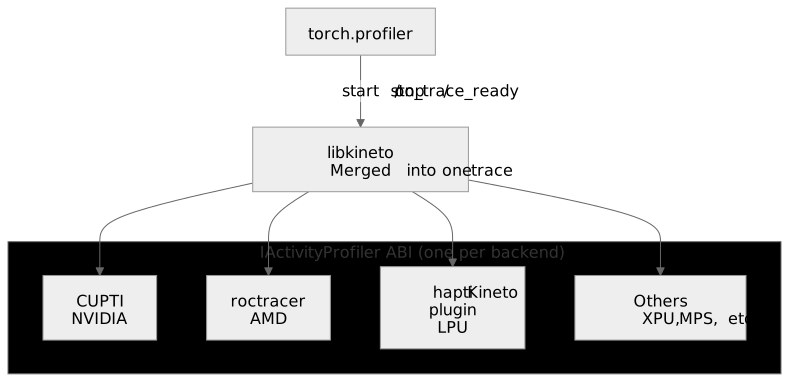
Structure of vendor tracers plugged into libkineto
The LPU backend connects through the same standard integration path that NVIDIA and AMD use. No
dedicated viewer or format is needed, and the torch.profiler UI, output formats, and Python entry points work as
is. The plugin's only role is to implement the IActivityProfiler interface so that Kineto can drive hapti just
like any other backend.
6.2 Registering the Plugin
1 2 3 | |
hapti.kineto.register() registers the plugin with Kineto as an
IActivityProfiler. Call it once per process; calling it more than once is safe.
Why runtime calls are visible
The plugin uses the same instance of the hart runtime already loaded in the process, so it observes every
Ha* runtime API call the application makes. If runtime calls do not appear, see
Troubleshooting.
If the plugin build is missing, registration fails immediately with an error.
1 | |
6.3 Running the Profiler
To collect LPU event data, ProfilerActivity.PrivateUse1 must be included in the activities list.
1 2 3 4 5 6 7 8 9 | |
PrivateUse1 is the dispatch key that PyTorch reserves for external accelerator backends, and it is the slot where
the LPU is registered. It shares the same key as the lpu device described in
Torch Device Semantics.
6.4 Collected Items and Flow Arrows
Depending on the activity kinds Kineto requests, the plugin includes the following data in the trace.
| Kineto activity kind | LPU mapping |
|---|---|
PRIVATEUSE1_RUNTIME |
Runtime API calls (Ha*). Memory allocation calls include the number of bytes allocated |
PRIVATEUSE1_DRIVER |
Runtime lower-layer calls |
CONCURRENT_KERNEL |
Device kernel execution ranges (see Device Timeline Collection) |
GPU_MEMCPY |
Host↔device memory transfers and bandwidth information |
EXTERNAL_CORRELATION |
Links between CPU operations and LPU activity |
GPU_MEMCPY is Kineto's generic name for this activity kind. The plugin reuses it because a custom kind would not be displayed correctly in the torch.profiler UI.
Items not collected on the Kineto path
- Hardware counters — Only the kernel timeline is collected; counters are not included. If you need hardware
counter analysis, use
haprof --device-trace. haptiannotations — Ranges specified withhapti.annotate()are not recorded on this path. To name ranges in the PyTorch trace, use the standard PyTorch APItorch.profiler.record_function()(see PyTorch Profiler Integration).
Flow Arrows
CPU operations and LPU activity are linked in two steps. PyTorch assigns an external ID to each CPU operation, and the
plugin maps the correlation id of each runtime call made inside that operation to the external ID. Kernels and
memory transfers share the same correlation id as the runtime call that caused them, so torch.profiler
automatically draws flow arrows from the CPU operation range to the device activity range.
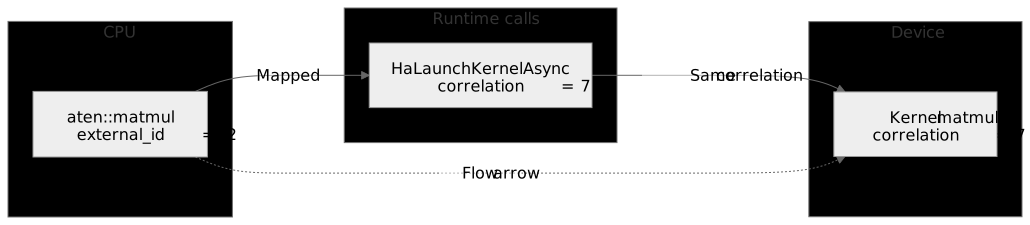
Linkage from external ID → correlation id → device record
With this structure you can trace back which Python/PyTorch code called a given device kernel.
6.5 Device Timeline Collection
When the CONCURRENT_KERNEL activity is requested, the plugin sets up the device record ring when the profiling
region (profile() block) starts, and collects the records and releases the ring when the region ends. When the
GPU_MEMCPY activity is also requested, memory transfer record collection is enabled as well.
| Environment variable | Effect and description |
|---|---|
HAPTI_KINETO_DEVICE_TRACE |
Disables device timeline collection if the value is 0, false, or off (default: enabled) |
HAPTI_KINETO_DEVICE |
Specifies the target device explicitly. If unset, uses the current device of the thread that opened the profiling region |
If the device timeline cannot be created or a problem occurs during collection, the plugin reports it through a
torch.profiler warning.
| Warning message | Meaning and action |
|---|---|
No LPU device (S6) time in this trace: ... |
Device profiling setup failed. The cause is shown at the end of the message |
LPU device (S6) time was captured from device N by default |
No device was bound when the region started, so the default device (N) was used. Open the region after the device is already in use, or specify it directly with HAPTI_KINETO_DEVICE |
... LPU device activities fell outside the capture window and were dropped |
Kernels not yet completed when the region ended are excluded from collection |
... bytes of device records were overwritten before the reader drained them |
A record ring overrun left gaps in the device timeline |
N LPU devices in one session; only device M gets a named trace row |
The region used several devices, and only the lowest-numbered one gets a named row |
6.6 When Records Are Converted
On the Kineto path, all records are converted at once when the region ends (stop()).
No data appears in the trace during the profiling region, and if the process terminates abnormally (SIGKILL or
similar), the data accumulated in the buffer is lost.
6.7 Choosing Between haprof and the Kineto Plugin
The two methods are alternatives to choose between by purpose, not tools to use together. If both are enabled in the same process, the same activity is collected twice, and contention for the single device record ring can cause device activity to be missing from one of the traces.
| Aspect | Kineto plugin | haprof |
|---|---|---|
| Output trace | A single integrated torch.profiler output file |
Separate .pftrace and .json files |
| Profiling scope | Only the profile() code block |
The entire run of the target process |
| Linkage to CPU operations | Automatic, through flow arrows | Requires matching correlation ids manually |
| Source code changes | Requires one line of register() code |
None (uses LD_PRELOAD) |
| Non-PyTorch workloads | Not supported | Supported |
| Device timeline collection | Supported (enabled by default) | Supported (--runtime-trace) |
| Hardware counter collection | Not supported | Supported (--device-trace) |
hapti annotations |
Not supported (use record_function) |
Supported |
| Viewers | TensorBoard, Perfetto, Chrome tracing | Perfetto, Chrome tracing |
When to use which:
- The team already has a
torch.profiler-based analysis pipeline → Kineto plugin - You need hardware counter analysis →
haprof --device-trace - The profiling target is a general C++/Python program outside PyTorch →
haprof
Next Steps
- Annotations — How to name source code ranges
- Device Tracing — Detailed hardware counter analysis
- Python API — Signature of
hapti.kineto.register